Krust is a native Kubernetes desktop app for production operations on macOS. If you are evaluating tools, compare Features and start with Quick Start.
I’ve used kubectl for 6 years. My .zshrc has 40+ aliases. I can type kgp -n production | grep -v Running faster than most people can open a browser tab. When someone suggested I try a Kubernetes GUI, my first reaction was: “Why would I want a slower version of something I already know?”
I was wrong. Not about kubectl — it’s still great for scripting, automation, and quick one-liners. But for the daily operational workflow — checking pod status, reading logs, inspecting resources, debugging issues — a GUI eliminates friction I didn’t realize I had.
Here’s what a week of switching from kubectl to Krust looked like.
Monday: “This Is Just a Fancy Pod List”
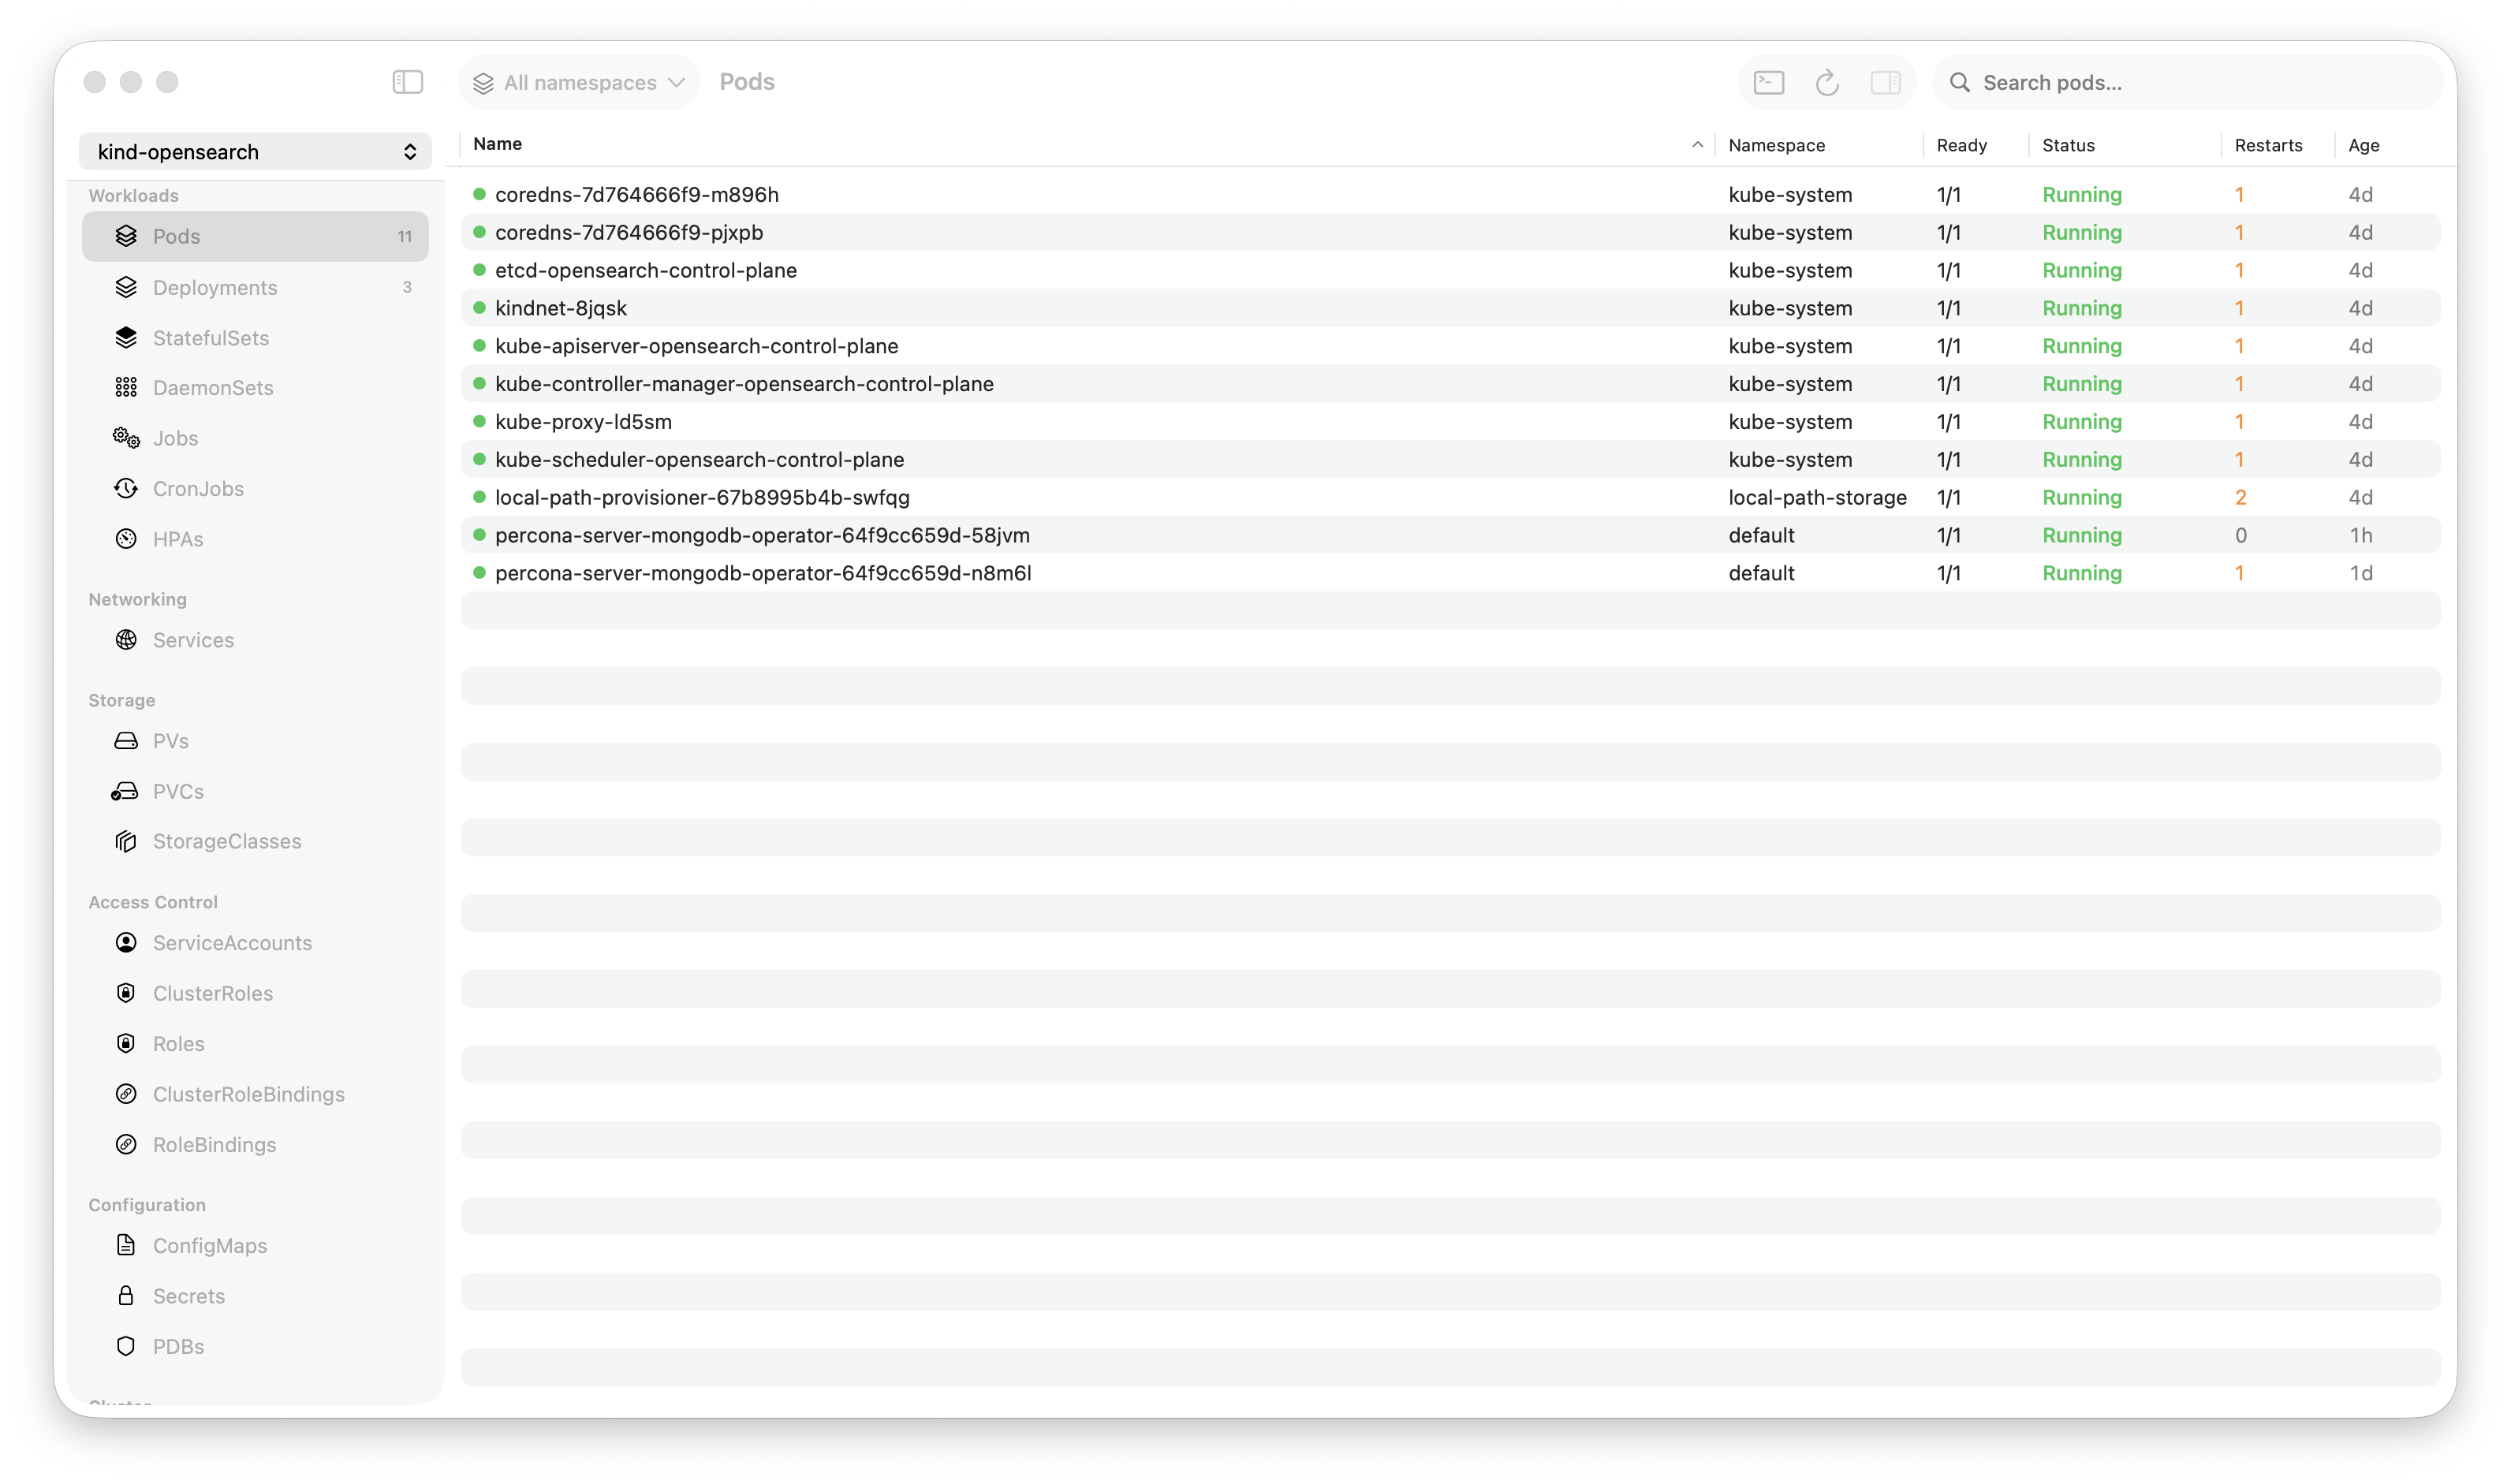
First impression: a table of pods. Not that different from kubectl get pods, just with colors and sorting. I clicked around, looked at deployments, services, nodes. Fine. A table is a table.
Then I noticed something. Every time I clicked a different resource type — Deployments, StatefulSets, Services — the data was already there. No loading spinner. No API call. Krust watches all resource types in real time. The data lives in memory, pre-indexed. Navigating between resources is instant because there’s nothing to fetch.
In kubectl, every command is a fresh API call. kubectl get pods, wait. kubectl get deploy, wait. kubectl get svc, wait. Each one takes 200-800ms depending on cluster size and network latency. Individually small. Collectively, it adds up to minutes per day of waiting for tables to print.
By Monday afternoon, I stopped noticing the speed. It just felt normal. That’s when you know a tool is fast — when fast becomes the baseline and everything else feels slow.
Tuesday: Logs Changed Everything
I was debugging a service that was returning intermittent 503s. In kubectl, my workflow would be:
# Which pods are in the deployment?
kubectl get pods -l app=checkout -n production

# Pick one, tail logs
kubectl logs checkout-7f8d4-abc -n production -f --tail=500

# Not this pod. Try another.
kubectl logs checkout-7f8d4-xyz -n production -f --tail=500

# Found something. Search for the pattern.
kubectl logs checkout-7f8d4-xyz -n production --tail=5000 | grep "upstream timeout"

# How many pods have this error?
for pod in $(kubectl get pods -l app=checkout -n production -o name); do
  echo "=== $pod ==="
  kubectl logs $pod --tail=1000 | grep -c "upstream timeout"
done
Five commands to answer “which pods are throwing upstream timeouts?”
In Krust: clicked the deployment → clicked “Logs” → selected “All Pods” → typed “upstream timeout” in the search box. Results across all 8 pods, highlighted, in 5ms. Found that 3 of 8 pods were hitting the same upstream, all on the same node.
That one interaction saved 10 minutes. And it wasn’t a special case — this is how log debugging works every single time.
The log viewer holds 200,000 lines in a Rust ring buffer. I was streaming from 8 pods simultaneously, searching across all of them, and the UI never stuttered. In an Electron-based tool, 8 concurrent log streams would have my fan spinning.
Wednesday: I Discovered the Inspector
I’d been clicking into resources and reading their details, but I hadn’t really used the inspector panel properly until Wednesday.
Click on a pod → the right panel shows everything: status, conditions, containers with their resource limits and current usage, restart count, events, IP addresses, node assignment. All in one view, no scrolling through a wall of YAML.
The killer detail: container resource limits alongside live metrics. The inspector shows cpu: 250m / 500m (limit) and memory: 180Mi / 256Mi (limit). In kubectl, this requires two commands — kubectl describe pod for limits and kubectl top pod for current usage — and manual cross-referencing.
I caught a memory-hungry container that was at 240Mi / 256Mi. Not crashing yet, but one traffic spike away from OOM. In kubectl, I probably wouldn’t have noticed until it actually crashed. The visual proximity of “current” next to “limit” makes problems obvious.
Thursday: Multi-Cluster Without Context Switching
My team manages three clusters: dev, staging, production. In kubectl:
kubectl config use-context production
kubectl get pods -n checkout
# done, switch back
kubectl config use-context staging
kubectl get pods -n checkout
# compare mentally, switch back again
kubectl config use-context dev
Context switching in kubectl is stateful and error-prone. Forget which context you’re in? kubectl delete pod hits the wrong cluster. Everyone has a war story.
In Krust, all three clusters are connected simultaneously via multi-cluster support. The pod table has a “Cluster” column. I can see the same deployment across dev, staging, and production without switching anything. Sort by cluster, compare replica counts, check which version is deployed where.
Thursday’s win: noticed that staging was running chart version 2.3.1 while production was still on 2.2.8. A three-version gap that nobody had noticed because nobody was comparing them side by side. Quick helm upgrade in production (through Krust’s Helm UI), verified, done.
Friday: Port Forwarding Without Terminal Tabs
My Friday debugging workflow usually involves port-forwarding 2-3 services to test locally. In kubectl:
# Terminal tab 1
kubectl port-forward svc/api-gateway 8080:80 -n production

# Terminal tab 2
kubectl port-forward svc/redis 6379:6379 -n production

# Terminal tab 3
kubectl port-forward pod/postgres-0 5432:5432 -n production
Three terminal tabs occupied. If any connection drops, I notice only when my request fails. Then I have to find the right tab, restart the forward.
In Krust, port forwards are managed in a dedicated panel. Click to start, click to stop. Auto-reconnect when the connection drops. Visual indicator of active/disconnected state. All in one view, no terminal tabs consumed.
Small quality-of-life improvement, but over a week it eliminated dozens of “wait, which tab was my port forward?” moments.
The Weekend Verdict
After five days, here’s my honest assessment:
Where Krust Wins Over kubectl
| Workflow | kubectl | Krust |
|---|---|---|
| Multi-pod log debugging | Multiple commands, manual aggregation | One click, instant search |
| Resource inspection with metrics | describe + top + mental merge | Single inspector panel |
| Multi-cluster comparison | Context switching (error-prone) | Side-by-side, always connected |
| Helm release management | Flag memorization | Visual history, diff, preview |
| Port forwarding | Terminal tabs, manual reconnect | Managed panel, auto-reconnect |
| Finding resource issues | You need to know what to look for | Visual indicators surface problems |
Where kubectl Still Wins
| Workflow | Why kubectl is better |
|---|---|
| Scripting & automation | Pipes, loops, jq — GUIs can’t match this |
| Quick one-liners | kgp alias is faster than opening an app |
| CI/CD pipelines | kubectl is a CLI tool, GUIs don’t belong here |
| Custom output formatting | -o jsonpath, -o custom-columns |
| Remote/SSH sessions | No GUI available |
The Real Answer: Both
I didn’t replace kubectl. I stopped using it for things a GUI does better. My workflow now:
- Operational monitoring and debugging → Krust (logs, pod status, multi-cluster overview)
- Quick checks → kubectl aliases (still faster for
kgp | grep) - Scripting and automation → kubectl (obviously)
- Incident response → Krust (logs + AI diagnostics + visual resource state)
The biggest shift wasn’t any single feature. It was the cognitive load reduction. kubectl requires you to hold the cluster state in your head — remember namespaces, piece together resource relationships, cross-reference different command outputs. A GUI externalizes that state into a visual layout. Your brain does less bookkeeping and more thinking.
For the Skeptics
I know what you’re thinking, because I thought the same things:
“GUIs are for people who can’t use the terminal.” I spent 6 years in the terminal. I still use it. The GUI isn’t a crutch — it’s a different tool for different tasks. You don’t use vim when Excel is better for spreadsheets.
“It’ll be slow.” Krust is 160MB of RAM. Written in Rust and Swift, not Electron. Pod table handles 1,500+ pods without stuttering. Log search across 100K lines in 5ms. It’s faster than kubectl for read operations because data is pre-loaded.
“I’d have to learn a new tool.” It took me about 15 minutes to feel comfortable. The interface maps directly to Kubernetes concepts. If you know kubectl, you know what every tab and column means.
Try It
brew install vanchonlee/tap/krustGive it a week. Keep kubectl in your terminal. Use both. See which tool you reach for when something breaks at 2 AM.
Krust is a native Kubernetes desktop app for macOS built with Rust and Swift. 160MB RAM, 27 resource types, multi-cluster, AI diagnostics. Free tier available, with Pro reserved for incident-grade workflows.