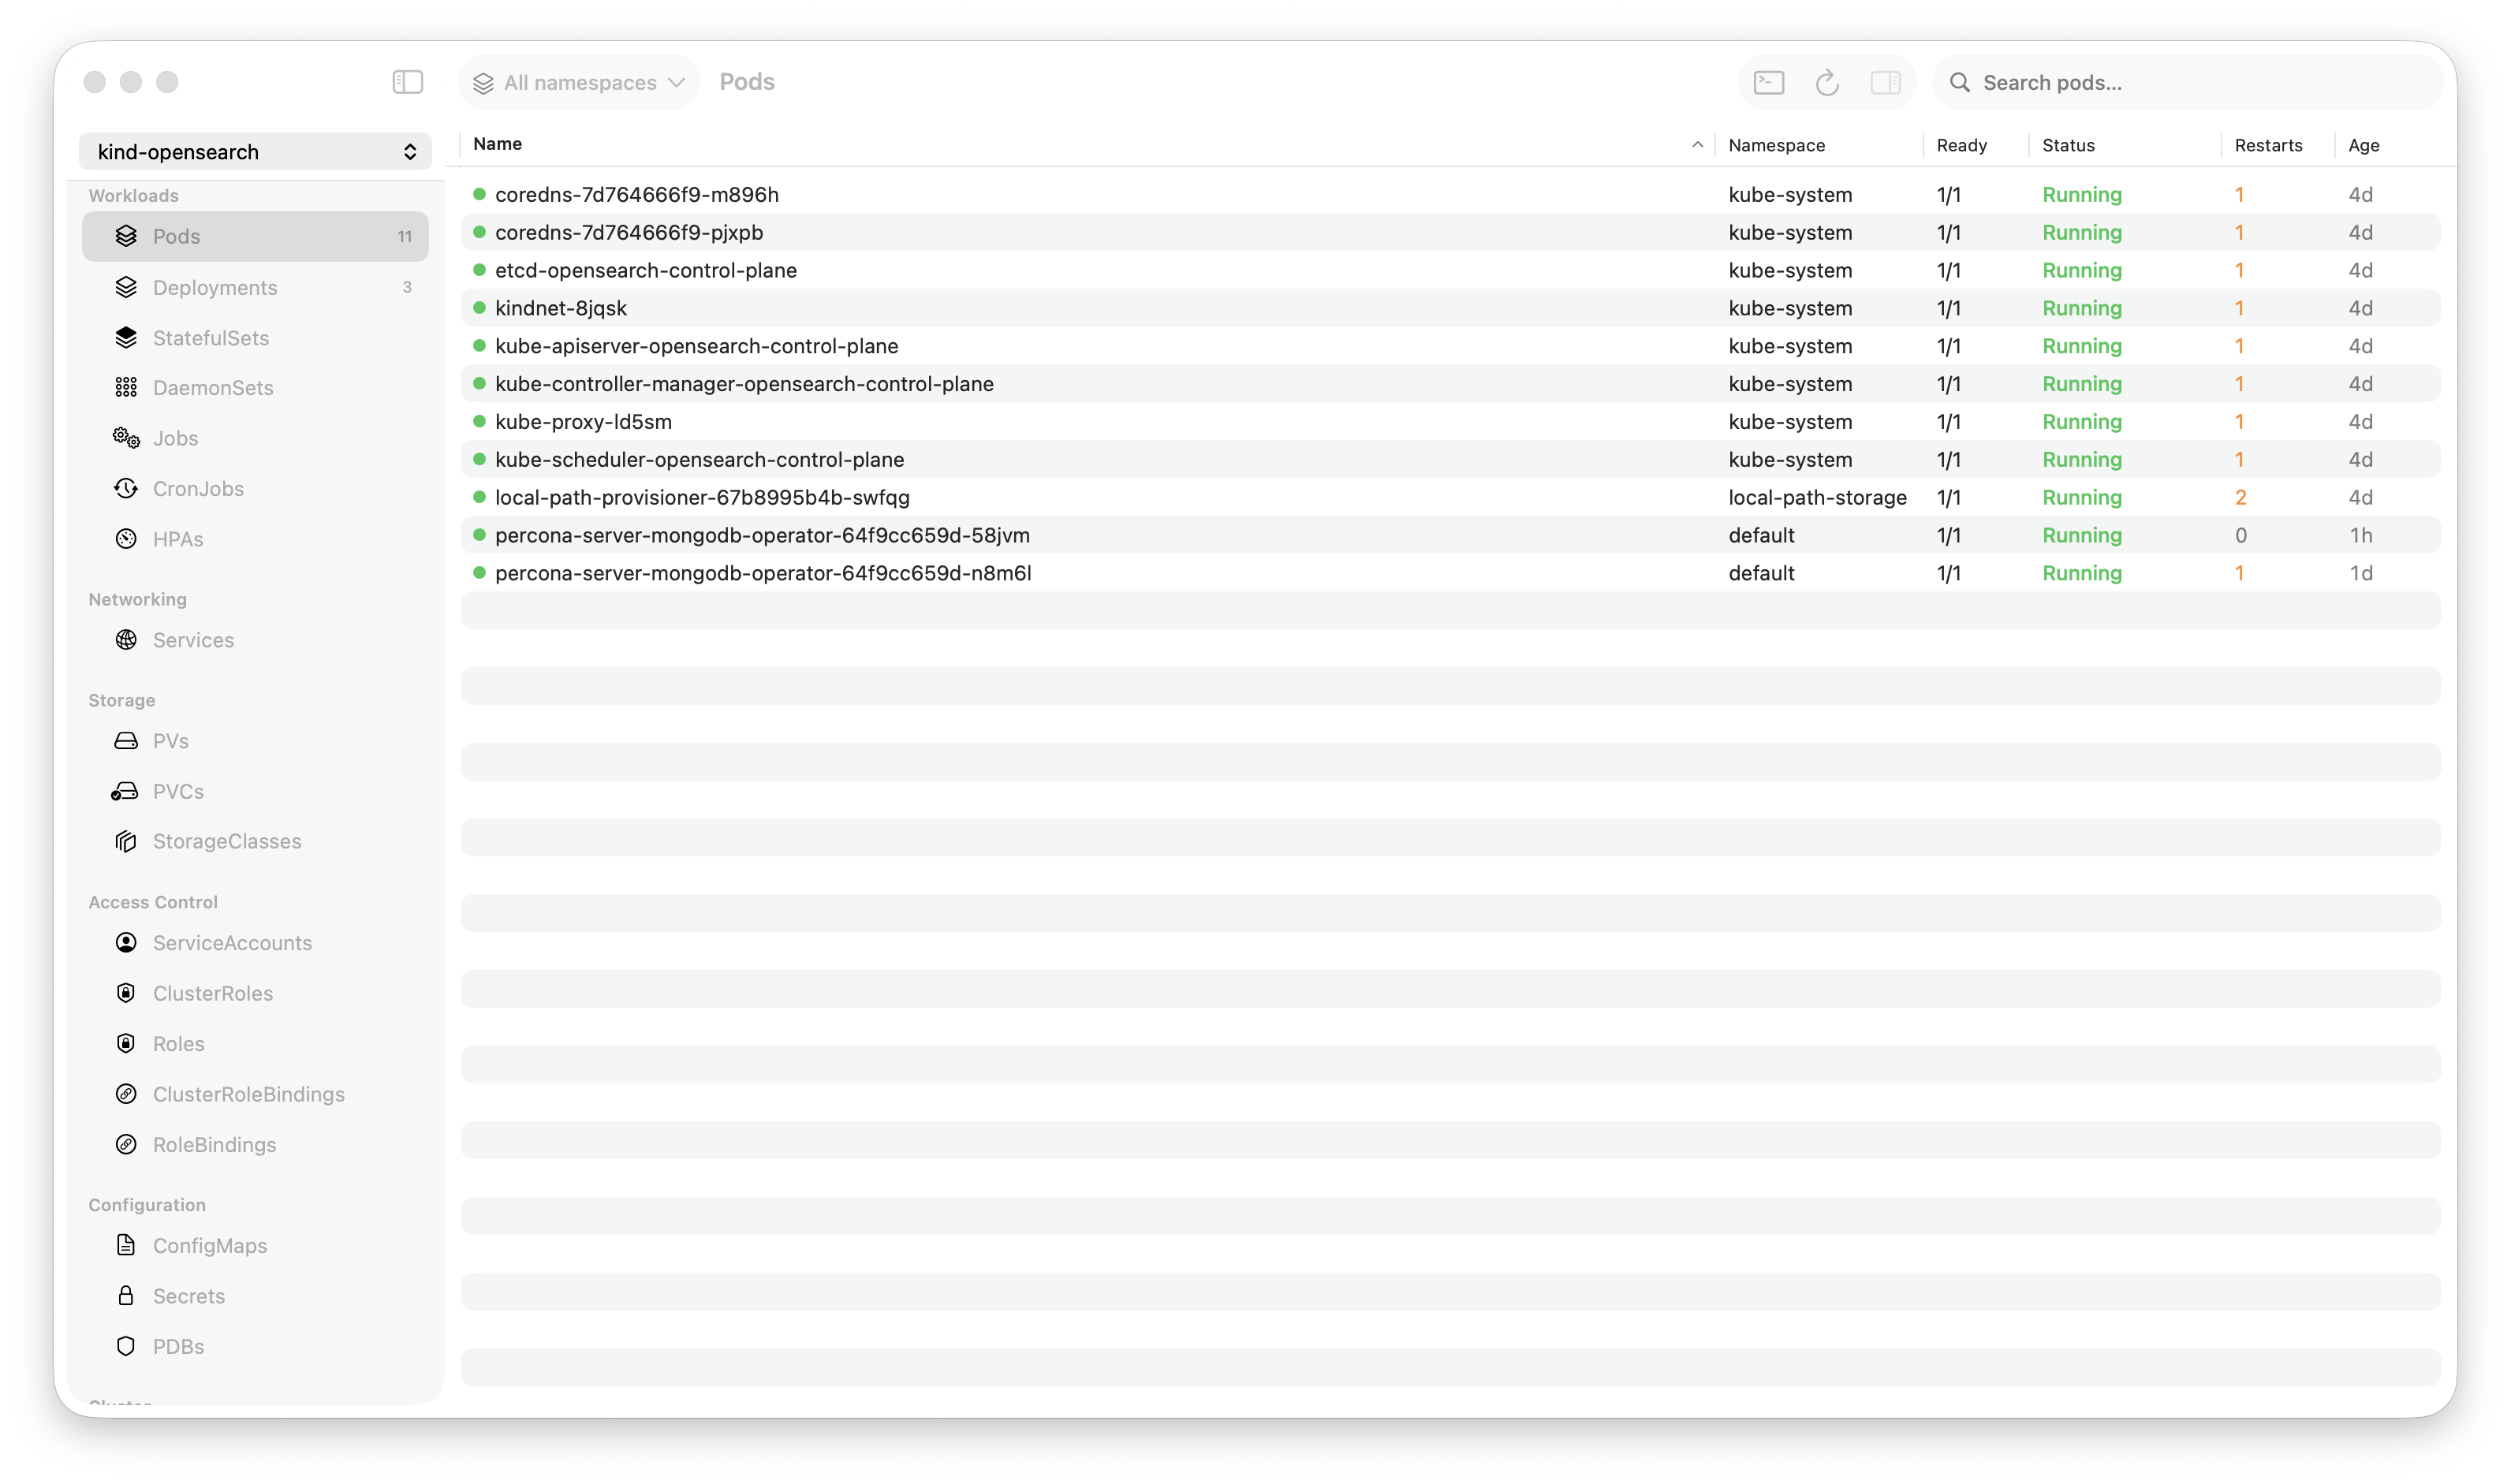
Krust is a native Kubernetes desktop app for production operations on macOS. If you are evaluating tools, compare Features and start with Quick Start.
I love k9s. Seriously. It’s the best terminal-based Kubernetes tool ever built. The keyboard-driven navigation, the speed, the minimal resource usage — k9s proved that you don’t need an Electron app to manage Kubernetes.
I’m not here to tell you to stop using k9s. I’m here to tell you there are specific workflows where a native GUI does things a terminal physically cannot. If you’re already a k9s power user, Krust fills the gaps without the Electron tax that made you avoid GUIs in the first place.
First: What k9s Gets Right
Let’s acknowledge why k9s is great, because Krust doesn’t try to replace these strengths:
- Keyboard-first navigation —
:pod,:deploy,:svc. Muscle memory, zero mouse. - Minimal footprint — 18-35MB RAM. You can run it on a Raspberry Pi.
- SSH-friendly — Works over SSH, in tmux, on remote servers. No display server needed.
- Fast startup — 0.3 seconds. Open, check, close.
- YAML editing — Edit resources in-place with your
$EDITOR.
If your workflow is “SSH into bastion → check pods → maybe tail a log → exit,” k9s is the perfect tool. Krust doesn’t run over SSH and never will. That’s not what it’s for.
But if you’re sitting at your Mac — which, if you’re reading this, you probably are — here’s where a native GUI offers something fundamentally different.
1. Multi-Pod Log Aggregation with Search
This is the biggest gap. In k9s, you can tail logs from one pod at a time. Press l on a pod, see its logs. Want to see logs from all pods in a deployment? You can’t. Not in a single view.
The common workaround: use stern in a separate terminal. But stern is a firehose — no search, no filtering, no bookmarks. You pipe it to grep and hope you catch the pattern before the buffer scrolls past.
In Krust:
- Click a deployment → Logs → “All Pods”
- 8 pods streaming simultaneously, interleaved chronologically, prefixed with pod names
- Search across all streams: type a pattern, 100K-line buffer searched in 5ms
- Filter by log level: show only ERRORs across all pods
- Bookmark important lines, jump between them
This isn’t a minor convenience. During an incident, “which pods are throwing this error?” is the first question. k9s answers it one pod at a time. Krust answers it instantly across all pods.
2. Visual Diff: Helm Revisions, Resource Changes
k9s shows you the current state of resources. What it can’t show you is what changed.
- What values changed in the last Helm upgrade?
- How does the deployment spec differ between staging and production?
- What did the last
kubectl applyactually modify?
In Krust, Helm revision diff is built in. Click a release → History → Diff. Side-by-side comparison with additions, removals, and changes color-coded. No temp files, no diff command, no helm get values --revision N for each revision.
For resource comparison across clusters: connect both clusters, open the same deployment in each, compare visually. k9s connects to one cluster at a time.
3. Multi-Cluster Side by Side
k9s supports context switching. :ctx → select a context. But it’s one context at a time. Switching contexts clears your current view, loads the new cluster, and you lose your place.
Krust connects to all your clusters simultaneously. The resource table shows a Cluster column. You can see the same deployment across dev, staging, and production in a single scroll. No switching, no losing context, no “wait, which cluster am I looking at?”
This matters for:
- Deployment verification — “Is the same version running in staging and production?”
- Incident triage — “Is this happening in all clusters or just one?”
- Resource comparison — “Why does staging have 3 replicas but production has 8?”
All visible at a glance, without typing a single command.
4. Resource Metrics Alongside Status
k9s shows a resource list. If you have the metrics plugin configured, you can see CPU/memory in a separate view. But the metrics aren’t inline with the pod status, conditions, and events.
Krust’s inspector panel shows it all together:
- Pod status and conditions
- Container resource requests and limits
- Live CPU and memory usage next to the limits
- Restart count and last restart reason
- Events for this specific pod
The visual proximity matters. “Memory: 240Mi / 256Mi (limit)” is an immediate warning — one spike away from OOM. In k9s, you’d need to cross-reference describe output with top pod output, mentally matching pod names.
5. AI Diagnostics
k9s has no AI integration (and probably shouldn’t — it’s a terminal tool). But if you’re already at your Mac with a GUI, having an AI agent that can inspect pods, read logs, check events, and cross-reference resources is genuinely useful.
Right-click a CrashLoopBackOff pod → “Diagnose with AI” → the agent pulls all relevant data and tells you: “Exit code 137, OOM killed, memory limit 256Mi, usage peaked at 400Mi. Increase limit or optimize memory.”
You could do this yourself. You’d inspect the pod, check events, tail logs, read the exit code, look up what 137 means, check the memory limit. The AI does it in 10 seconds. Not because it’s smarter, but because it doesn’t have to type commands.
6. Port Forward Management
k9s has port forwarding via Shift-F. It works. But:
- No visual indicator of which forwards are active
- No auto-reconnect when the connection drops
- Forward disappears when you navigate away from the pod view
Krust has a dedicated port forward panel. Start/stop with clicks. Auto-reconnect on connection loss. All active forwards visible regardless of which resource tab you’re in. Small thing, but if you port-forward 3-4 services daily, the friction reduction adds up.
The Elephant in the Room: Resource Usage
The reason k9s users avoid GUIs is Lens. Lens at 1.2GB of RAM and 35% CPU under load is offensive to anyone who chose k9s because it runs in 20MB.
Here’s the honest comparison:
| k9s | Krust | Lens | |
|---|---|---|---|
| RAM (idle) | 18 MB | 72 MB | 380 MB |
| RAM (heavy load) | 750 MB | 160 MB | ~1,250 MB |
| CPU (idle) | <1% | <1% | 2-3% |
| CPU (log streaming) | 2-3% | 3-5% | 12-18% |
| Startup | 0.3s | 0.8s | 4.2s |
| Battery impact | Low | Low | High |
Krust uses 4x the RAM of k9s. That’s the cost of a GUI with rich table rendering, a log viewer with attributed strings, and an inspector panel. But it’s 10x less than Lens. It sits in the “native app” range — comparable to Calendar or Notes — not the “browser pretending to be an app” range.
If 72MB vs 18MB is a dealbreaker, stick with k9s. But if your objection to GUIs was “they eat my RAM and spin my fans,” Krust doesn’t have that problem.
When to Use Which
Here’s my current setup:
| Scenario | Tool |
|---|---|
| Quick pod check from terminal | k9s |
| Remote server / SSH | k9s |
| Scripting & automation | kubectl |
| Multi-pod log debugging | Krust |
| Helm management (history, diff, upgrade) | Krust |
| Multi-cluster overview | Krust |
| Incident response at my desk | Krust |
| Resource inspection with metrics | Krust |
| AI-assisted diagnostics | Krust |
They’re complementary. k9s for terminal workflows, Krust for visual workflows. See the full comparison for details. The tools don’t compete — they cover different scenarios with different strengths.
Try It
If you’re a k9s user who’s never tried a non-Electron Kubernetes GUI:
brew install vanchonlee/tap/krustKeep k9s. Open Krust alongside it. Next time you’re debugging logs across multiple pods or comparing Helm releases between clusters, try it in Krust. See if it saves you time.
If it doesn’t, close it. 160MB of RAM back. No harm done.
Krust is a native Kubernetes desktop app for macOS built with Rust and Swift. Not a k9s replacement — a complement for the workflows where a GUI is genuinely better.