Krust is a native Kubernetes desktop app for production operations on macOS. If you are evaluating tools, compare Features and start with Quick Start.
You’re the only DevOps engineer. Or one of two. You manage dev, staging, and production. Maybe a second production cluster in another region. Maybe a shared services cluster for monitoring.
That’s 3-5 Kubernetes clusters, and you’re context-switching between them dozens of times a day.
kubectl config use-context production-us
kubectl get pods -n checkout
# looks fine
kubectl config use-context production-eu
kubectl get pods -n checkout
# wait, which context am I in?
kubectl config current-context
# ok, production-eu
kubectl get pods -n checkout
# hmm, fewer replicas than US. intentional?
kubectl config use-context production-us
kubectl get deploy checkout -n checkout -o jsonpath='{.spec.replicas}'
# 8
kubectl config use-context production-eu
kubectl get deploy checkout -n checkout -o jsonpath='{.spec.replicas}'
# 3... that's wrong
Six context switches and eight commands to discover a replica mismatch. And the dangerous part: the moment you forget which context you’re in, kubectl delete or kubectl apply hits the wrong cluster.
Krust connects to all your clusters simultaneously via multi-cluster management. One table. One view. No context switching. No risk of applying to the wrong cluster.
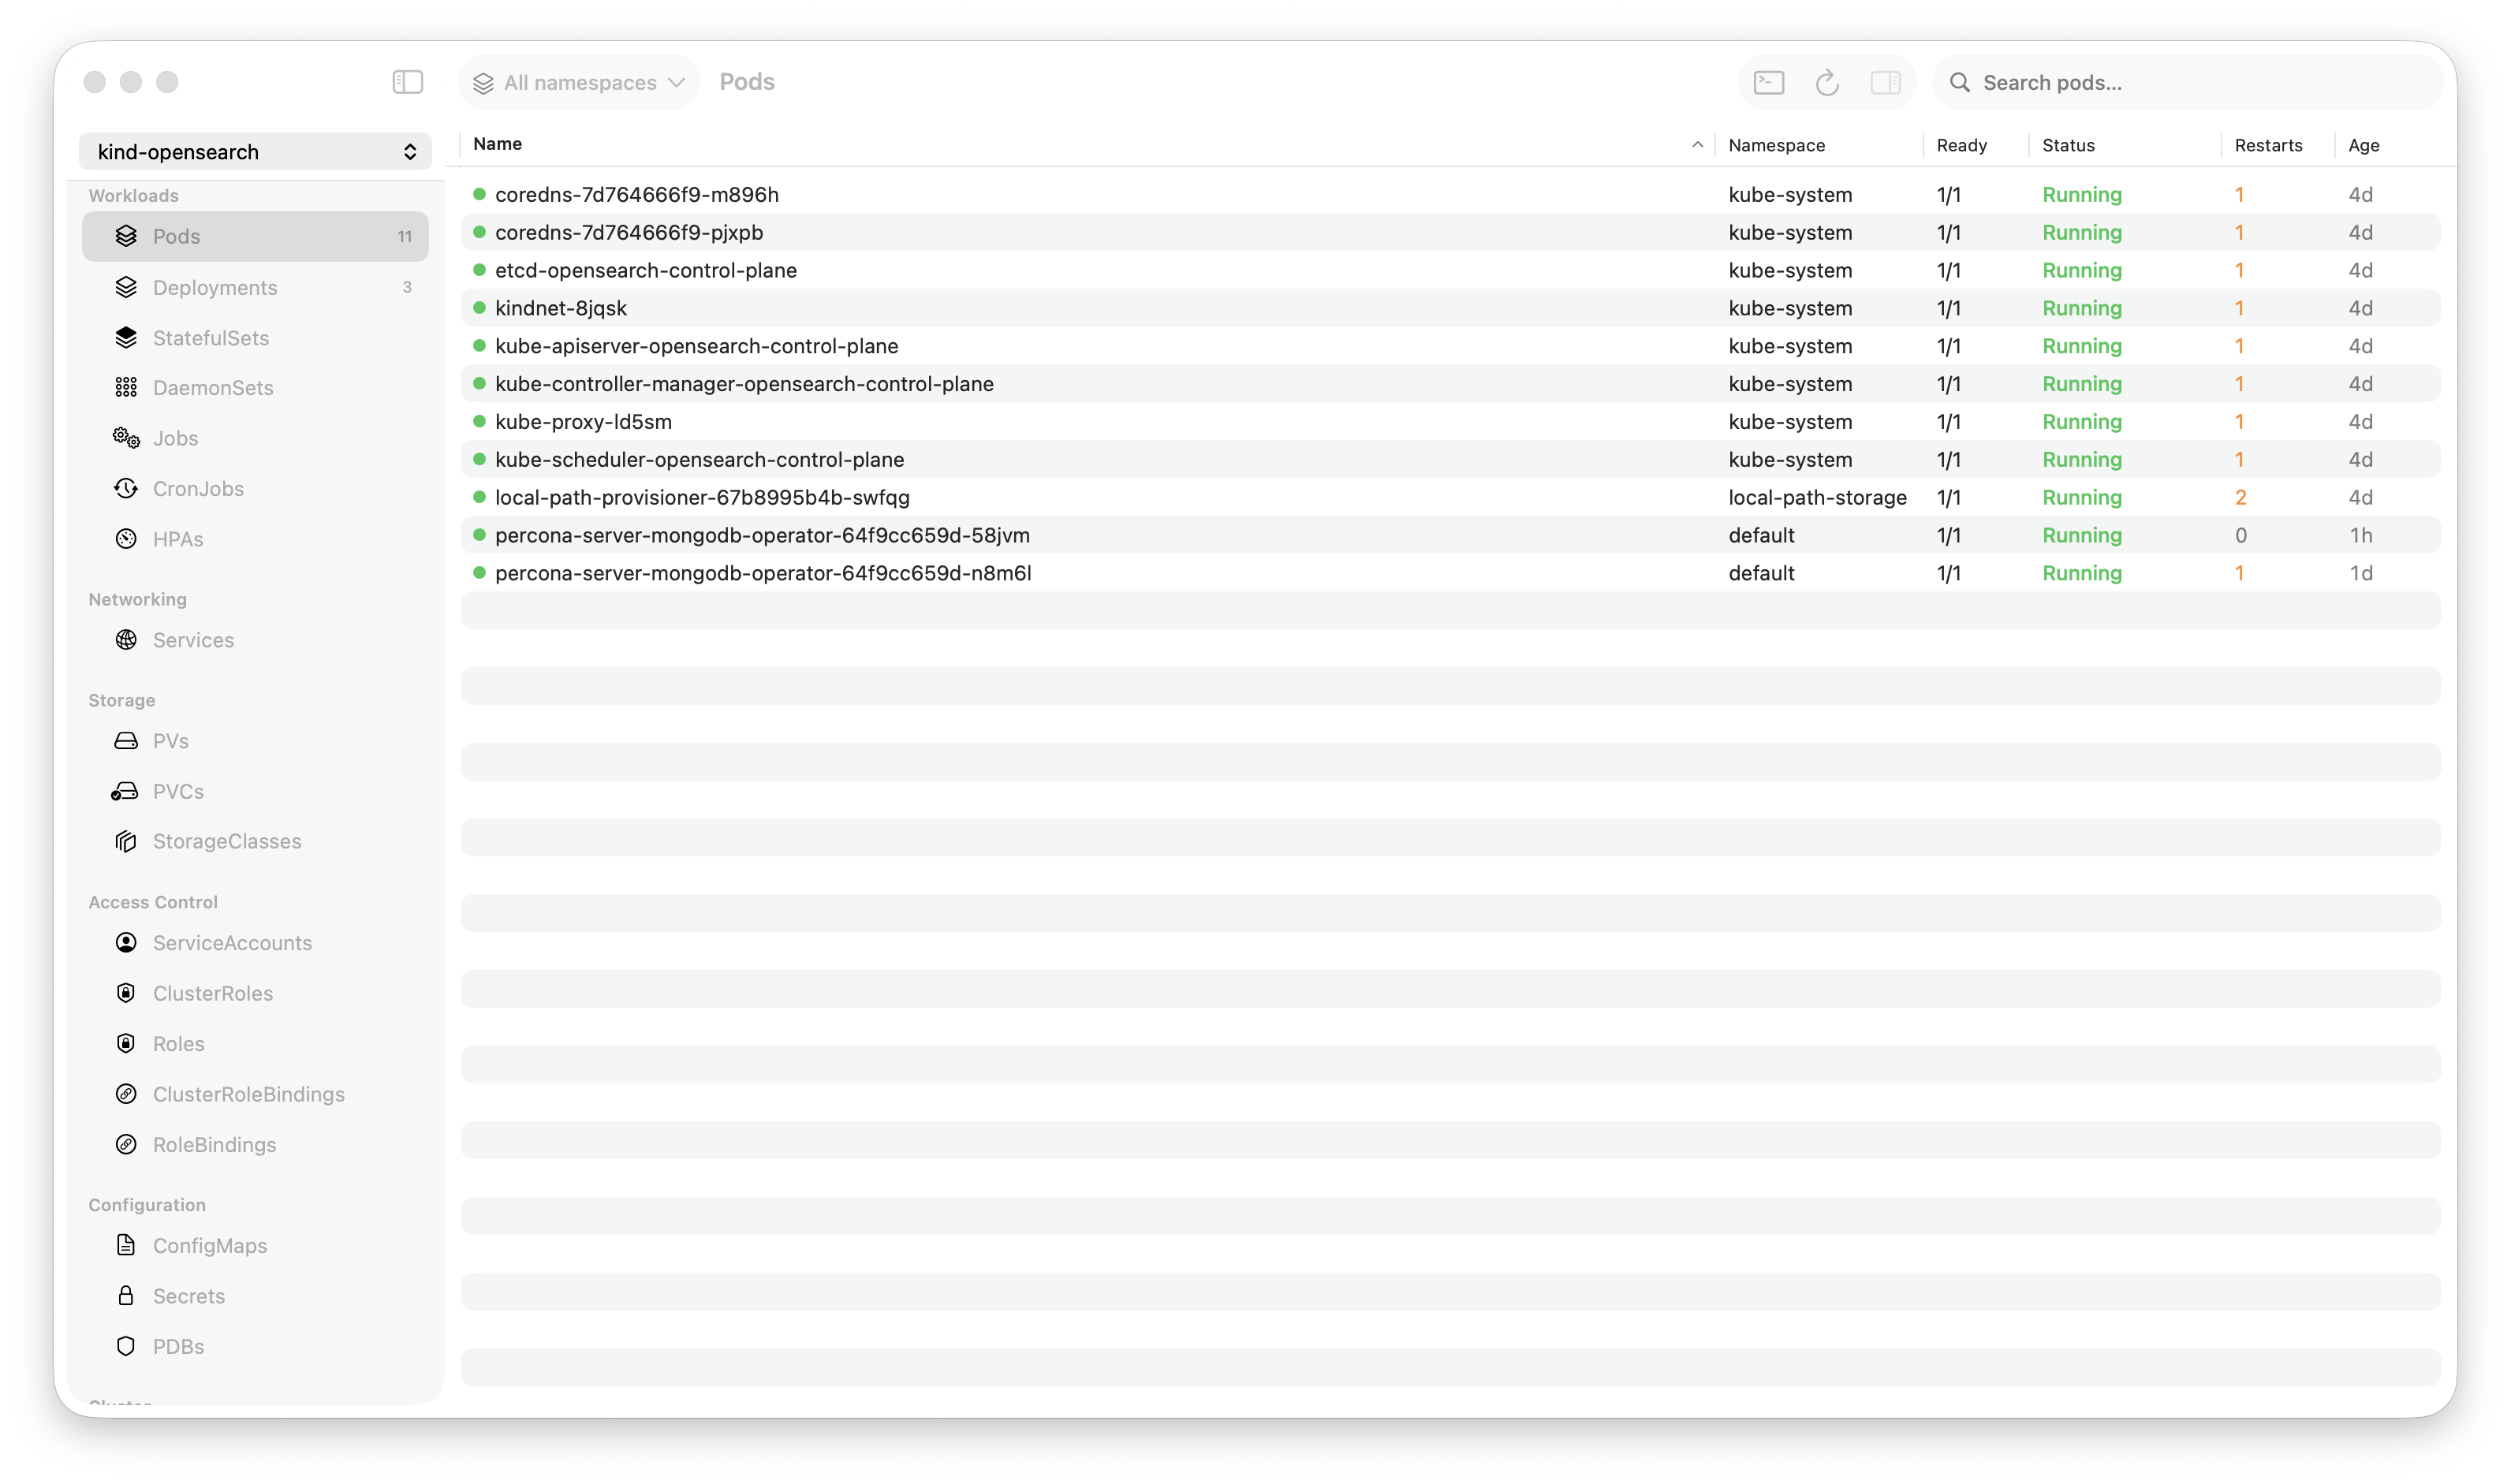
The Single-Table View
When you connect multiple contexts in Krust, every resource table gains a “Cluster” column. Pods, deployments, services, Helm releases, CRDs — all displayed together, tagged by cluster.
| Cluster | Name | Namespace | Status | Replicas | Image |
|---|---|---|---|---|---|
| prod-us | checkout | checkout | Running | 8/8 | checkout:v3.8.2 |
| prod-eu | checkout | checkout | Running | 3/3 | checkout:v3.8.1 |
| staging | checkout | checkout | Running | 2/2 | checkout:v3.9.0-rc1 |
| dev | checkout | checkout | Running | 1/1 | checkout:latest |
One glance:
- Production EU has 3 replicas vs US with 8 — probably wrong
- Production EU is on v3.8.1 while US is on v3.8.2 — missed an upgrade
- Staging is ahead on v3.9.0-rc1 — expected
- Dev is running
latest— normal for dev
This comparison happens passively. You don’t ask for it. You just see it because the data is side by side.
Why Solo/Small Teams Need This Most
Large teams have dedicated environments per team, runbooks for each cluster, and alerting that catches drift. Solo DevOps engineers are the runbook. You’re expected to know the state of every cluster at all times.
The cognitive load of multi-cluster management grows faster than the number of clusters:
- 1 cluster: You know everything. State fits in your head.
- 2 clusters: You mostly know. Occasional “is staging the same as prod?”
- 3 clusters: You rely on scripts or dashboards. Memory isn’t enough.
- 5 clusters: Context switching is a constant tax. Drift is invisible until something breaks.
A tool that shows all clusters simultaneously offloads this from your memory to your screen. You stop wondering “did I upgrade EU?” and start seeing “EU is on v3.8.1, US is on v3.8.2.”
What Multi-Cluster Enables
Deployment Verification
After upgrading a deployment in production-us, you need to verify it’s running the right version and all pods are healthy. Then do the same in production-eu.
Without multi-cluster view: Switch context, check pods, switch context, check pods. If you have 5 deployments across 3 clusters, that’s 15 checks with context switches between each.
With multi-cluster view: Sort by deployment name. All clusters visible. Scan for mismatches. 5 seconds.
Incident Triage
Alert fires: checkout is returning 500s. Which cluster? Which region? Is it happening everywhere or just one?
Without multi-cluster view: SSH into your monitoring dashboard, figure out the source, then switch to the right kubectl context, then debug.
With multi-cluster view: Pods tab, sort by status. CrashLoopBackOff pods in production-eu are visible immediately. Production-us is fine. The issue is region-specific. You know in 3 seconds what would have taken 30.
Configuration Drift Detection
Over time, clusters drift. Someone applies a ConfigMap change to staging but forgets production. A HPA is configured differently across regions. An ingress annotation is missing in one cluster.
Without multi-cluster view: You don’t notice until it causes a problem. Or you write scripts to compare cluster state. Or you audit manually every few weeks.
With multi-cluster view: Browse any resource type. See all clusters. Drift is visible as differences in the table. “Why does staging have 5 ConfigMaps in the auth namespace but production has 4?”
Helm Release Comparison
“Are all clusters on the same Helm chart version?”
In the Helm tab, sort by release name:
| Cluster | Release | Chart | App Version | Revision |
|---|---|---|---|---|
| prod-us | redis | redis-18.4.0 | 7.2.4 | 12 |
| prod-eu | redis | redis-18.3.0 | 7.2.3 | 11 |
| staging | redis | redis-18.5.0 | 7.2.5 | 15 |
EU is one version behind. Staging is ahead (expected). The chart version gap tells you exactly what needs upgrading.
How It Works Under the Hood
Each cluster connection is an independent watcher. Krust opens separate Kubernetes watch streams per context, per resource type. The watchers run concurrently on Tokio worker threads — adding a cluster adds parallel work, not serial overhead.
Connection independence: If production-eu goes down (API server unreachable), the other clusters continue working. You see an error indicator on the EU connection, but the pod table still shows US, staging, and dev pods normally. No “connection lost, please reconnect” that kills your entire view.
Per-context caching: Each context maintains its own data cache. Removing a context immediately clears its data — no stale pods from a disconnected cluster lingering in the table.
Resource overhead: Each additional cluster adds roughly 15-25MB of RAM (for the watch connections and cached resource data). Four clusters ≈ 160-200MB total. Still less than a single Electron app connected to one cluster.
The Workflows
Morning Check (2 minutes)
- Open Krust (already connected to all clusters)
- Pods tab → sort by Status → scan for non-Running pods
- Deployments tab → scan for replica mismatches across clusters
- Helm tab → check for version drift
- Events tab → look for warnings in the last hour
No context switching. No commands. Just scanning tables. Two minutes to verify the state of your infrastructure.
Post-Deploy Verification (30 seconds)
- Deploy to production-us
- Pods tab → filter by deployment name → verify new pods are Running in production-us
- Same table → verify production-eu still has the old version (if rolling out region by region)
- Helm tab → confirm revision incremented in production-us
You see the rollout happening across clusters in real-time. No switching.
Incident Response (immediate)
- Alert fires
- Krust is already showing all clusters
- Sort by status → see which pods are failing
- Cluster column tells you where
- Click the failing pod → logs → diagnose
- Compare with healthy pods in other clusters for reference
The “figure out which cluster is affected” step — which can take 30-60 seconds in a terminal — is eliminated.
What About Dedicated Multi-Cluster Tools?
Tools like Rancher, Lens (with multi-cluster), and ArgoCD dashboards provide multi-cluster views. They’re good for what they do. But:
Rancher/Lens: Web-based or Electron. The performance overhead scales with clusters. Two clusters in Lens can easily hit 2GB+ RAM.
ArgoCD: Focused on GitOps deployments, not general resource browsing. Great for what it does, but doesn’t help you browse ConfigMaps or debug pod logs.
Custom dashboards: Grafana + Prometheus gives you metrics across clusters. But not resource state, not logs, not Helm releases. Different tools for different layers.
Krust fills the gap: a lightweight, native tool for operational resource management across clusters. Not a deployment platform. Not a monitoring dashboard. A workbench for the person who needs to see pods, logs, configs, and Helm releases across all clusters, right now.
Limitations
macOS-native focus. Krust optimizes the desktop experience for production Kubernetes operations on macOS, prioritizing responsiveness and low memory use during incidents.
No cluster provisioning. Krust connects to existing clusters via kubeconfig. It doesn’t create, destroy, or manage cluster infrastructure. Use your cloud provider’s CLI for that.
No RBAC aggregation. You see what your kubeconfig allows. If your production context has read-only access, you can’t edit resources in production through Krust. This is by design — Krust respects your existing access controls.
Try It
If you’re managing multiple Kubernetes clusters and spending time context-switching:
brew install vanchonlee/tap/krustAdd all your contexts. Open the pods tab. See everything at once. The replica mismatch you didn’t know about is probably in the first table you look at.
Krust is a native Kubernetes desktop app for macOS. Multi-cluster support connects to all your contexts simultaneously — no context switching, no risk of applying to the wrong cluster. 160MB base RAM + ~20MB per cluster. Free tier available, with Pro reserved for incident-grade workflows.