Krust is a native Kubernetes desktop app for production operations on macOS. If you are evaluating tools, compare Features and start with Quick Start.
PagerDuty fires at 2:17 AM. Checkout service is returning 500s. Revenue is dropping. You have 90 seconds before the escalation policy pages your manager.
This is a walkthrough of how I debug production incidents with Krust. Not a hypothetical. This is the actual workflow I used last week when our checkout service went down.
0:00 — Open Krust, See the Damage
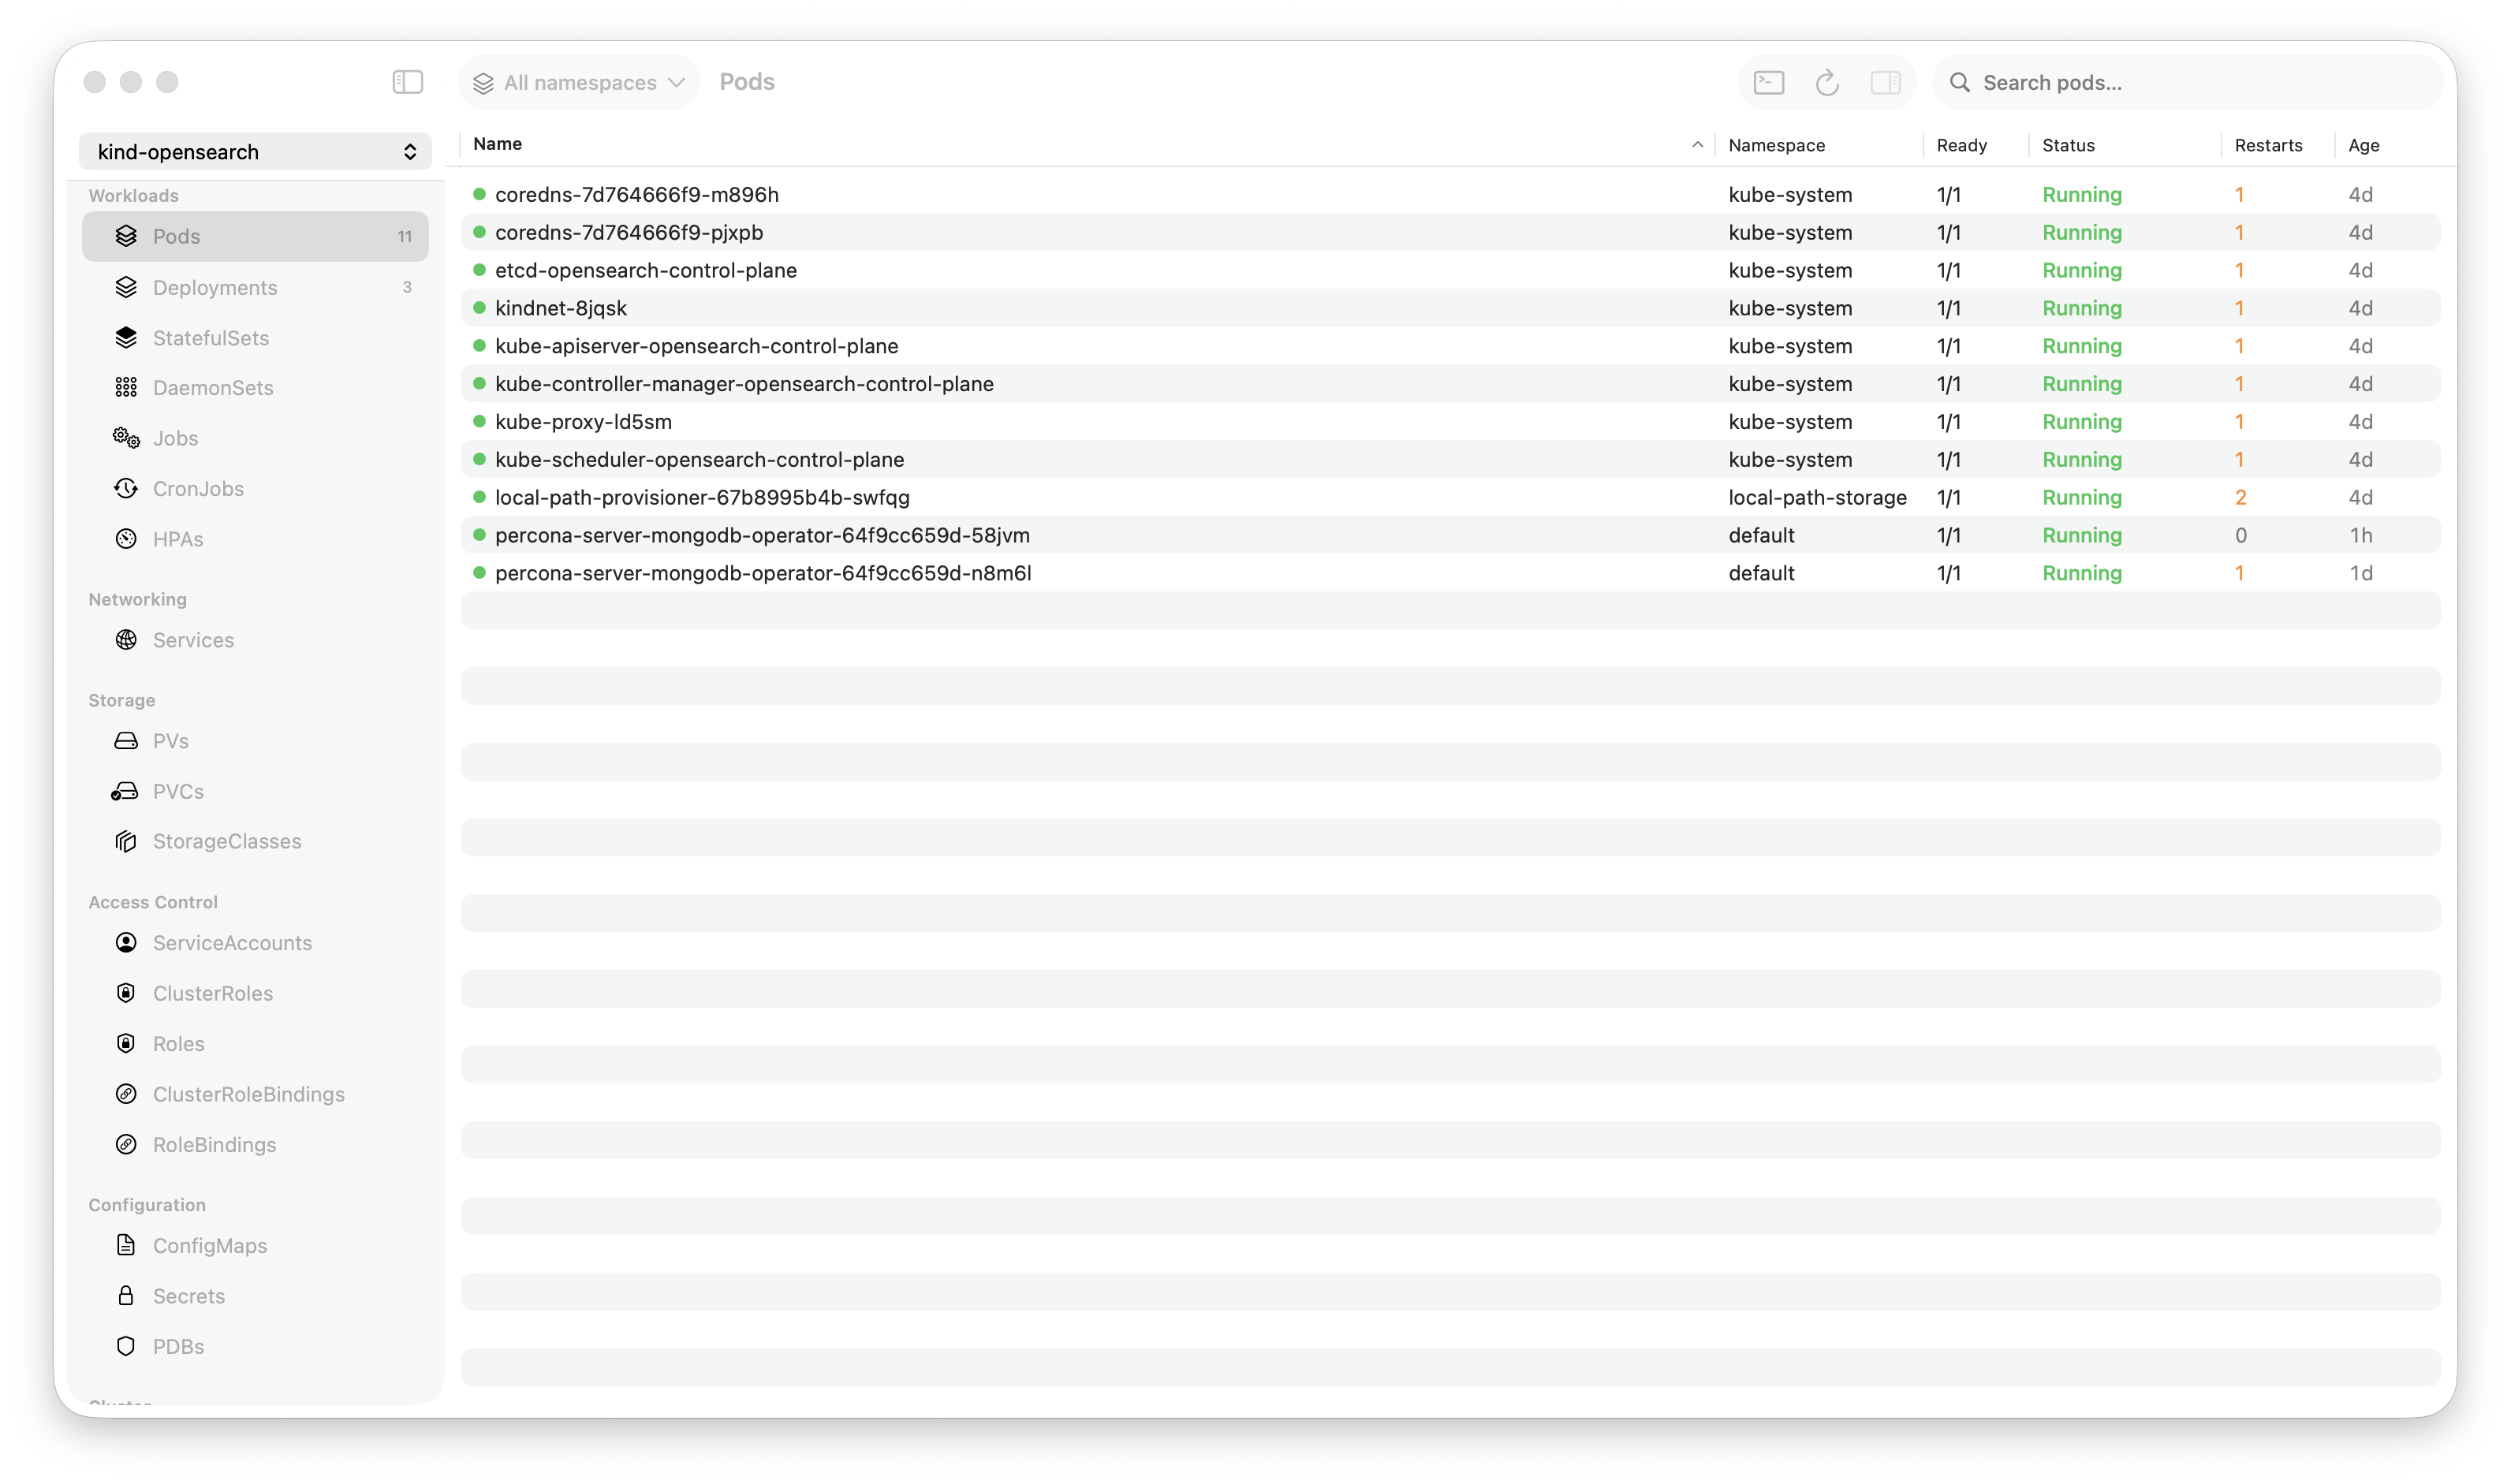
Krust is already connected to our production cluster. I keep it running — 160MB of RAM, no reason to close it. The pod table is live, updated by Kubernetes watch streams.
I see it immediately: 4 out of 8 checkout-api pods are in CrashLoopBackOff. Status column is red. No commands typed.
In kubectl, this would be:
kubectl config use-context production  # am I in the right context?
kubectl get pods -n checkout -l app=checkout-api
Two commands, ~2 seconds of typing, ~1 second of API latency. In Krust: zero commands, zero latency. The data is already on screen.
Time elapsed: 5 seconds.
0:05 — Check What Changed
Click the Helm tab. Sort by “Updated.” The checkout-api chart was upgraded 12 minutes ago — right before the errors started. Click “Diff” on the latest revision.
The diff shows one change: image.tag: v3.8.1 → v3.8.2.
Someone pushed a new version. The timing matches. This is probably the cause.
In kubectl + helm CLI:
helm history checkout-api -n checkout
helm get values checkout-api -n checkout --revision 14 > /tmp/v14.yaml
helm get values checkout-api -n checkout --revision 15 > /tmp/v15.yaml
diff /tmp/v14.yaml /tmp/v15.yaml
Four commands, temp files, manual cleanup. In Krust: two clicks.
Time elapsed: 15 seconds.
0:15 — Read the Logs
Click back to Pods. Click a crashing pod. Open logs. The last lines before the crash:
2024-01-15T02:15:43Z FATAL  Failed to connect to payments-db:5432 -
  connection refused
2024-01-15T02:15:43Z FATAL  Database migration check failed. Exiting.
The new version added a startup migration check. It’s trying to connect to payments-db, but the connection is being refused.
I didn’t need to search or grep. The crash happens immediately on startup, so the last few lines tell the story. But if I had needed to search — 100K-line buffer, 5ms search. Type the pattern, results are instant.
Time elapsed: 25 seconds.
0:25 — Cross-Reference
Is payments-db actually down? Click Services tab → find payments-db. It exists, has endpoints. Click the backing pods. They’re running. Readiness probes are passing.
So the database is up, but the checkout pods can’t reach it. Network policy? Click NetworkPolicies. There it is — a new network policy was applied that restricts egress from the checkout namespace. The migration check uses a different port (5433 for migrations vs 5432 for normal traffic), and the new policy only allows 5432.
In kubectl:
kubectl get svc payments-db -n database
kubectl get endpoints payments-db -n database
kubectl get networkpolicy -n checkout
kubectl describe networkpolicy checkout-egress -n checkout
# Read through the YAML, find the port list, notice 5433 is missing
Five commands, reading raw YAML output, mentally correlating port numbers. In Krust: four clicks through Services → Pods → NetworkPolicies, reading structured panels instead of raw YAML.
Time elapsed: 50 seconds.
0:50 — Fix It
Two options:
Quick fix: Roll back the Helm release to v3.8.1 (the version that worked). In Krust’s Helm tab, right-click → “Rollback to revision 14.” Confirm. Krust applies the previous manifest via server-side apply. No helm binary needed.
Proper fix: Update the network policy to allow port 5433. But at 2 AM during an incident, the quick fix wins. Roll back now, fix the network policy in the morning with a proper PR.
I click Rollback. Confirm the dialog. Watch the pod table — old pods terminate, new pods start with the previous image. Within 20 seconds, all 8 pods are Running.
Time elapsed: 75 seconds.
0:75 — Verify
Pods are all green. Click one, check logs — normal startup, no FATAL messages, requests flowing. Switch to Events tab — no new warnings.
Check the monitoring dashboard (separate tool) — 500 rate is dropping, checkout success rate climbing back to 99.9%.
Time elapsed: 90 seconds.
Incident resolved. Root cause identified. Service restored. Notes written for the morning postmortem.
What Made This Fast
Looking back, every time savings came from the same pattern: data was already available, and I didn’t have to ask for it.
| Step | kubectl approach | Krust approach | Time saved |
|---|---|---|---|
| See pod status | kubectl get pods (API call) | Already on screen (watch stream) | ~3s |
| Check Helm changes | 4 commands + temp files | 2 clicks + visual diff | ~30s |
| Read crash logs | kubectl logs + scroll | Click pod → logs panel | ~5s |
| Cross-reference services | Multiple kubectl get/describe | Click through tabs | ~20s |
| Rollback | helm rollback (requires CLI) | Right-click → Rollback | ~10s |
| Verify recovery | kubectl get pods again | Watch table turn green | ~3s |
Total savings: roughly 70 seconds. On a 90-second fix, that’s the difference between resolving on your own and escalating to your manager.
The Workflow Pattern
Every production incident follows the same diagnostic loop:
See the problem → Find what changed → Read the evidence →
Cross-reference → Fix → Verify
kubectl is optimized for individual commands. Each step requires typing a command, waiting for a response, and mentally connecting it to the previous step. You’re the integration layer.
A GUI is optimized for the loop. Data is pre-loaded. Navigation is clicks, not commands. Visual proximity (pod status next to events next to logs) lets your eyes do the cross-referencing instead of your working memory.
This doesn’t mean kubectl is bad. For scripting, automation, and CI/CD, kubectl is the right tool. But for incident response — where speed is measured in seconds and cognitive load is high — a GUI that eliminates the “fetch, parse, correlate” cycle has a real advantage.
The AI Shortcut
For the walkthrough above, I did the diagnosis manually — clicking through resources, reading logs, connecting the dots. But Krust also has an AI diagnostic agent.
If I’d right-clicked the crashing pod and selected “Diagnose with AI,” the agent would have:
- Inspected the pod (status, events, conditions)
- Pulled the crash logs
- Identified the “connection refused to payments-db:5432” error
- Checked the service and endpoints
- Reported: “Pod is crashing because the migration check can’t reach payments-db. Connection refused on port 5432 from checkout namespace.”
Would it have caught the network policy as root cause? Maybe — depends on whether it chose to check NetworkPolicies. But it would have gotten me 80% of the way in 10 seconds instead of 50.
The AI agent is best for the “gather and summarize” phase. The “cross-reference and fix” phase still benefits from human judgment — especially at 2 AM when the fix needs to be safe, not clever.
Try It
brew install vanchonlee/tap/krustNext time your pager fires, have Krust open alongside your terminal. See which one you reach for.
Krust is a native Kubernetes desktop app for macOS built with Rust and Swift. 160MB RAM, real-time watch streams, fast log workflows, Helm management, AI diagnostics. Free tier available, with Pro focused on incident debugging.